Table of Contents
This page contains instructions for GENI experimenters describing how to use GIMI on a GENI WiMAX aggregate. If you are a site administrator looking for instructions on how to add GIMI functionality to your site, please see the setup instructions.
Overview
GIMI provides I&M services for experimenters. Running a GIMI-enabled experiment involves three components:
- Instrument an experiment with OML
- Execute an experiment with OMF
- Archive experiment measurements to iRODS data grid
The steps required to instrument an experiment with OML are already well documented as well. Use these links to find out how to:
- Instrument an application that is written in C/C++, Ruby, or Python or
- Write a wrapper for an application written in another language, or one whose source code is not available
- Create an application definition for your application
Similarly, there is a already a great deal of documentation on using OMF on a WiMAX testbed. Refer to this self-guided tutorial for further details.
GIMI uses the iRODS data grid for archiving and further processing. The rest of this page describes how to get an iRODS account and then use it to archive experiment results gathered on a WiMAX testbed to iRODS.
Archiving an Experiment to iRODS
Get an iRODS account (one time only)
Use of iRODS is on an opt-in basis. To get an iRODS account, contact the designated administrator for your WiMAX testbed:
| Site | Contact |
| WINLAB | witestlab@… |
| NYU-Poly | witestlab@… |
Initialize your iRODS account (one time only)
The first time you use this account, you must initialize it using iinit and the values provided by your site administrator. For example:
$ iinit
One or more fields in your iRODS environment file (.irodsEnv) are
missing; please enter them.
Enter the host name (DNS) of the server to connect to:emmy9.casa.umass.edu
Enter the port number:1247
Enter your irods user name:ffund
Enter your irods zone:geniRenci
Those values will be added to your environment file (for use by
other i-commands) if the login succeeds.


Enter your current iRODS password:
Then add a line to your ~/.irods/.irodsEnv file indicating your default resource on the iRODS server. For example:
echo "irodsDefResource=iRODSUmass2" >> ~/.irods/.irodsEnv
Finally, use ipasswd to change your password from the default password given to you by the iRODS site administrator.
Archive an experiment to iRODS
To send your experiment data to iRODS, use the iarchive tool, which sends the experiment log files and measurement database to iRODS. You may also specify the iRODS collection (folder) to store these artifacts in, set metadata such as date and slice name, and send other files (such as the experiment script or application definition files) to iRODS together with the experiment results.
Here is an example that uses iarchive to archive the results of the experiment with ID ffund-default_slice-2012-11-26t23.01.39-05.00 to a new mycoopexp collection in iRODS:
ffund@omfserver-witest:~$ iarchive -e ffund-default_slice-2012-11-26t23.01.39-05.00 -c mycoopexp
INFO:      Creating collection mycoopexp
INFO:      Archiving /tmp/ffund-default_slice-2012-11-26t23.01.39-05.00-state.xml
INFO:      Archiving /tmp/ffund-default_slice-2012-11-26t23.01.39-05.00.log
INFO:      Archiving /var/lib/oml2/ffund-default_slice-2012-11-26t23.01.39-05.00.sq3
Run iarchive -h for more details on using this tool.
On some consoles, you may be able to run iarchive with no arguments to archive the last experiment you ran on that console. On other consoles, you must specify an experiment ID in order to archive the experiment.
View and analyze results
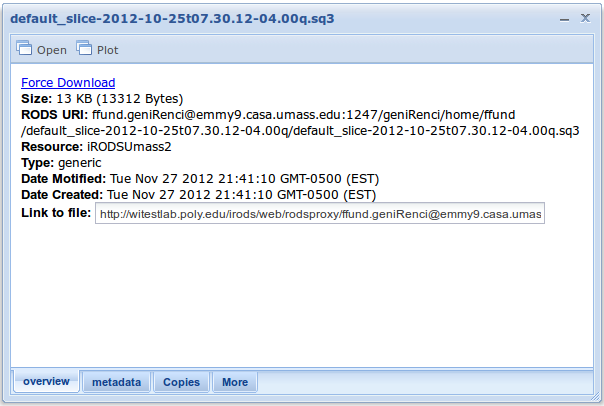
The NYU-Poly WiMAX site hosts an enhanced iRODS web browser which you can use to retrieve any of the files you have archived to iRODS and also view plots of experiment results within the browser.
To use this site, log on here with your iRODS user account information.
To plot experiment results, double-click an sq3 file in your iRODS directory, and choose "Plot":

Select the table you want to visualize and the fields to put on the x-axis and y-axis. You may also optionally choose a field to group results by. Then click "Plot" to see the result:

(Note that if there are multiple y-values for a given x-value, their average will be shown on the plot.)
You may also use any of the icommands on the WiMAX testbed console.
Attachments (2)
- gimi-screen1.png (33.6 KB ) - added by 11 years ago.
- gimi-screen2.png (70.4 KB ) - added by 11 years ago.
Download all attachments as: .zip